Imagine you are running a high-stakes casino. You have a limited supply of chips, and dozens of high-rollers are sitting at various tables. Each player has a “credit limit”—the maximum amount of chips they might need to stay in the game and eventually win. As the manager, your absolute nightmare is a “Deadlock.” This happens when every player at every table has some chips but needs just a few more to finish their hand, and you’ve run out of chips in the vault. Everyone is stuck. No one can play, no one can leave, and the house stops making money.
In the world of Operating Systems, this “manager” is the OS kernel, the “chips” are system resources (CPU, RAM, I/O devices), and the “players” are processes. To prevent this total system freeze, we use one of the most famous strategies in computer science: The Banker’s Algorithm.
If you’re building an Algorithm Visualizer for your blog, the Banker’s Algorithm is your “Final Boss.” It is complex, mathematical, and incredibly satisfying to see visualized. Let’s dive deep into every single gear and lever that makes this algorithm work.
1. What is a Deadlock, Really?
Before we can avoid a deadlock, we have to understand the enemy. A deadlock is a specific state where a set of processes are blocked because each process is holding a resource and waiting for another resource held by another process in the same set.
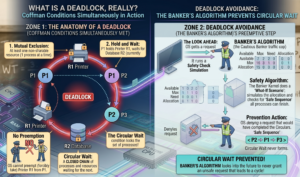
For a deadlock to occur, four conditions (The Coffman Conditions) must hold true simultaneously:
-
Mutual Exclusion: At least one resource must be non-sharable (only one process can use it at a time).
-
Hold and Wait: A process is holding at least one resource and waiting for more.
-
No Preemption: The OS cannot forcibly take a resource away from a process.
-
Circular Wait: A closed chain of processes exists where each is waiting for the next.
The Banker’s Algorithm is a Deadlock Avoidance strategy. It doesn’t just wait for a deadlock to happen and then fix it; it looks into the future to ensure the “Circular Wait” condition can never happen.
2. The Philosophy: Why “The Banker”?
Developed by the legendary Edsger Dijkstra, the algorithm is named after a small-town banker.
A banker never allocates all the cash in the vault at once. They know that every customer has a maximum credit limit. If the banker lends out too much money to too many people, they might reach a point where no single customer has enough money to finish their business and pay the bank back.
The Golden Rule of the Banker: Never grant a loan (resource) unless you can prove that, even in the worst-case scenario, there is at least one sequence of events where everyone gets their maximum needs met and returns the money.
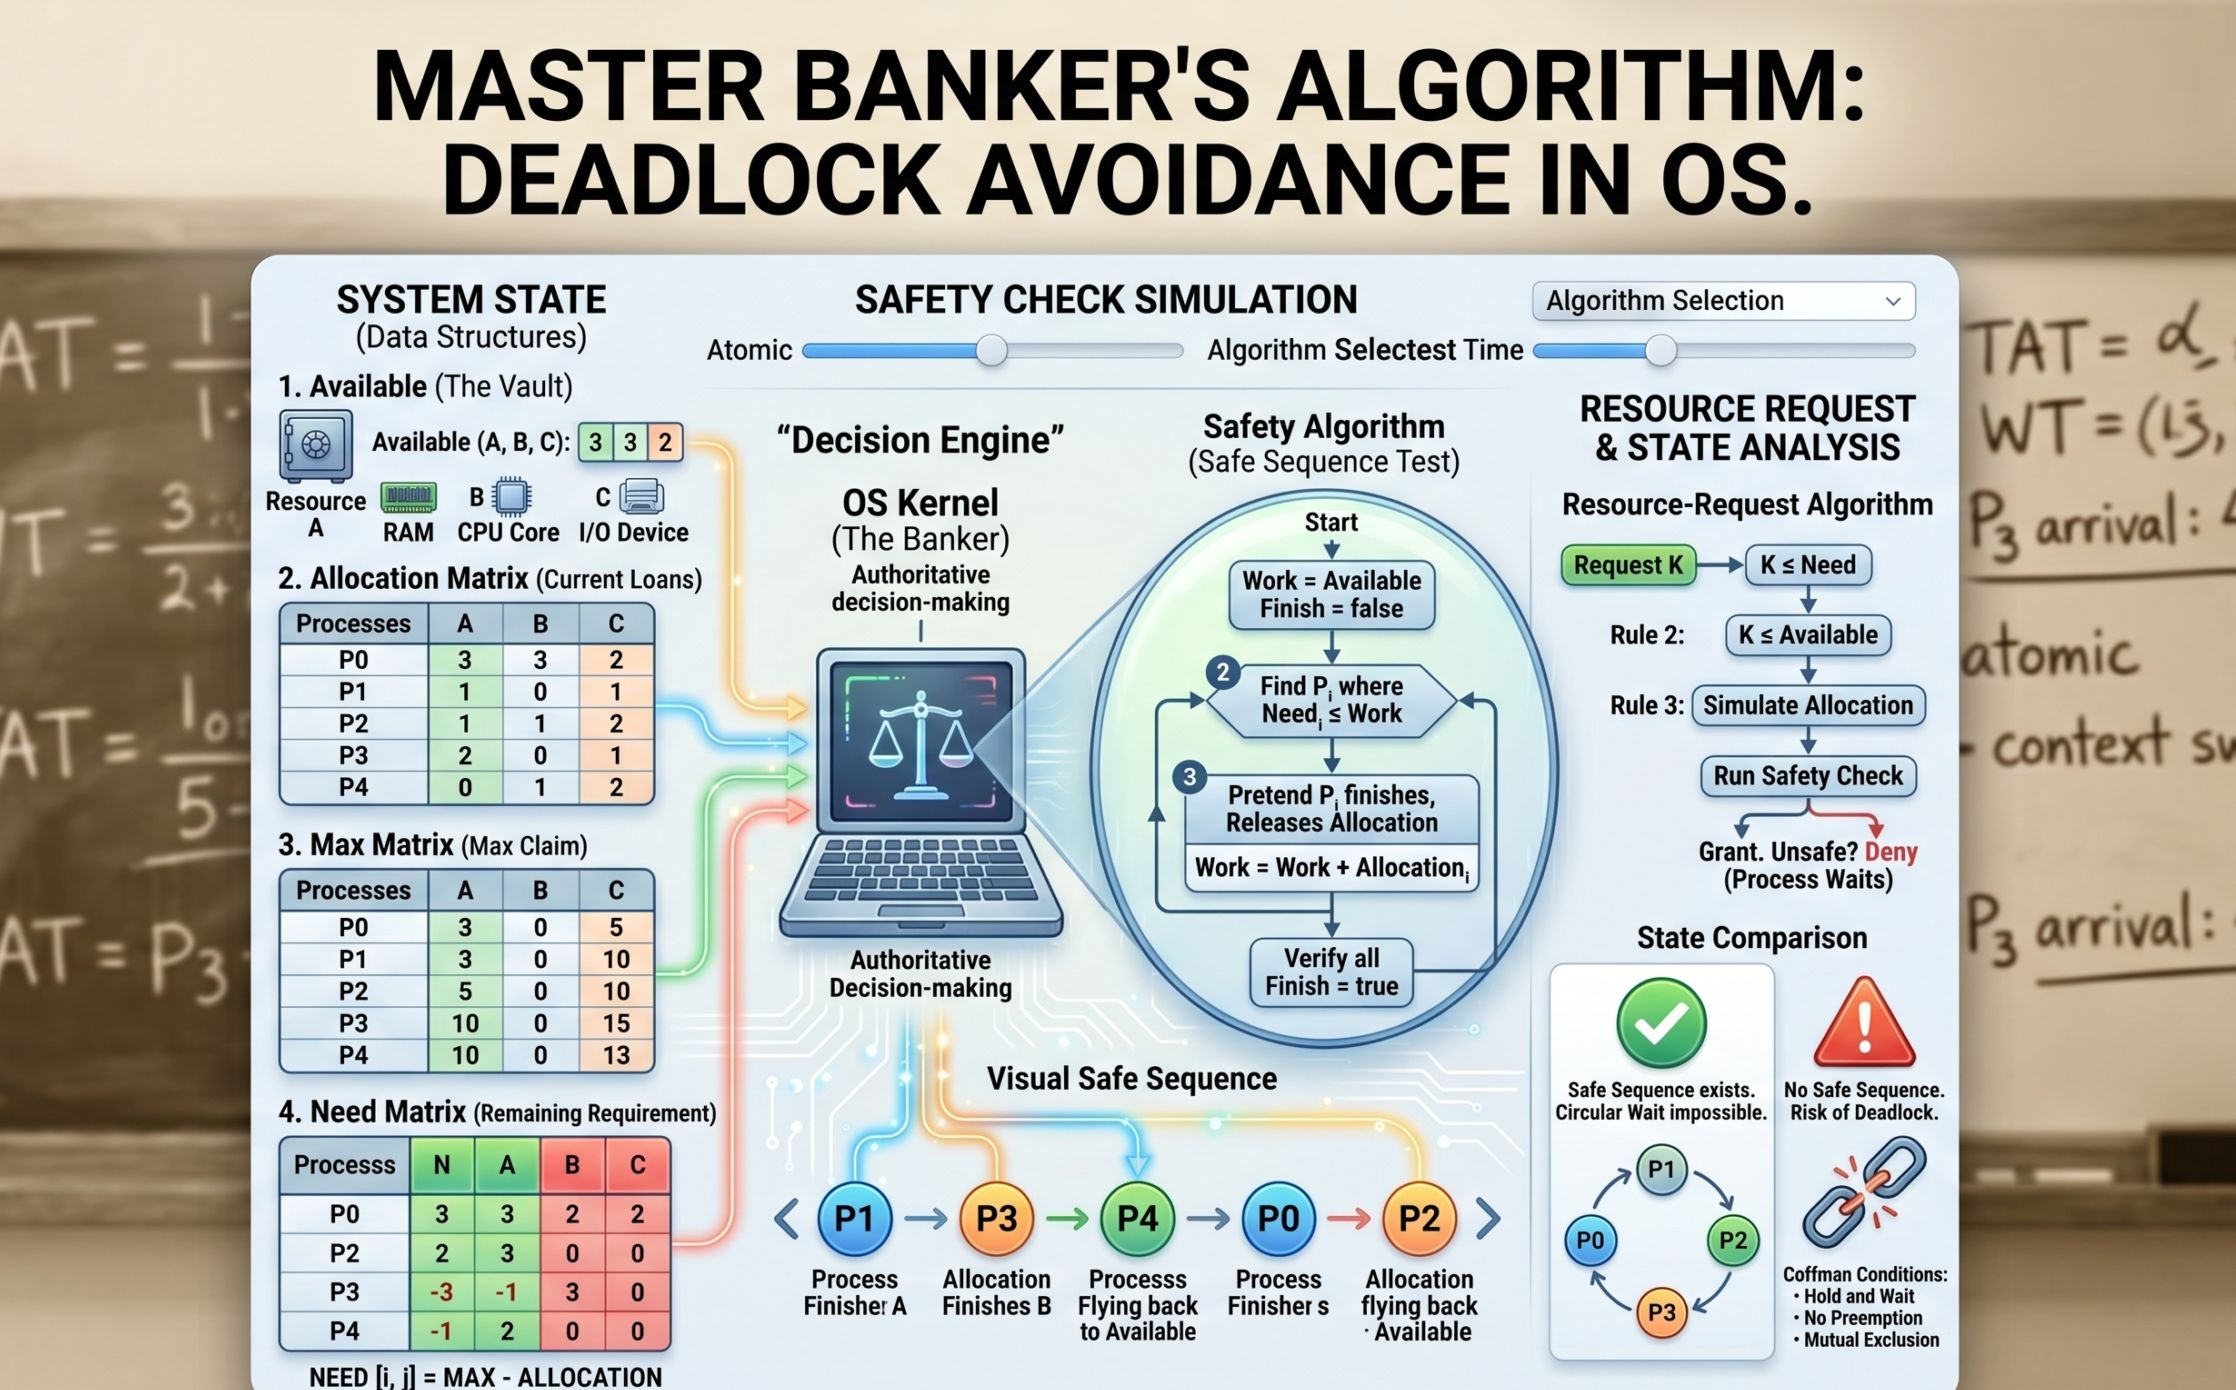
3. The Prerequisites: Four Essential Data Structures
To build a visualizer for this, your code needs to track four specific pieces of information. Let’s assume we have $n$ processes and $m$ types of resources (like RAM, Disk Space, and Printer).
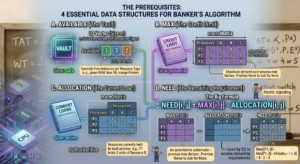
A. Available (The Vault)
A 1D array of size $m$.
If Available[0] = 3, it means there are 3 units of Resource A (e.g., 3GB of RAM) currently sitting idle in the system.
B. Max (The Credit Limit)
An $n \times m$ matrix.
This defines the maximum demand of each process. A process must declare this number before it starts. If $P_1$ says its Max for Resource B is 5, it promises never to ask for 6.
C. Allocation (The Current Loan)
An $n \times m$ matrix.
This tracks exactly how many resources each process is holding right now. If $P_1$ has 2 units of Resource B, then Allocation[1, 1] = 2.
D. Need (The Remaining Requirement)
An $n \times m$ matrix.
This is the most important calculation for your visualizer. It tells the OS how much more a process might ask for before it finishes.
The Formula:
$$Need[i, j] = Max[i, j] – Allocation[i, j]$$
4. The Safety Algorithm: The Heart of the Process
This is the sub-routine the OS runs to check if the system is in a Safe State. A Safe State means there exists at least one Safe Sequence—an order of execution where everyone can finish.
The Logical Steps for Your Visualizer:
-
Work and Finish: Create a copy of the
Availablearray calledWork. Create a boolean arrayFinishinitialized tofalsefor all processes. -
Find a Candidate: Look for a process $P_i$ that is not finished (
Finish[i] == false) and whose currentNeedis less than or equal to theWorkavailable.-
Analogy: Can I find one customer whose remaining debt I can cover with the cash I have in the vault right now?
-
-
The “Assume and Release” Step: If you find such a process, assume it takes the resources, completes its task, and returns everything it was holding back to the vault.
-
Work = Work + Allocation_i -
Finish[i] = true
-
-
Repeat: Go back to Step 2 and look for the next process that can now finish with the increased
Workamount. -
The Verdict: If every single process is marked
true, the sequence is Safe. If you get stuck and some processes are stillfalse, the state is Unsafe.
Our portfolio Makeuser
5. A Practical Example: The Calculation Walkthrough
Let’s look at a system with 3 resources: A (10), B (5), C (7).
Current Available is (3, 3, 2).
| Process | Allocation | Max | Need (Calculated) |
| $P_0$ | (0, 1, 0) | (7, 5, 3) | (7, 4, 3) |
| $P_1$ | (2, 0, 0) | (3, 2, 2) | (1, 2, 2) |
| $P_2$ | (3, 0, 2) | (9, 0, 2) | (6, 0, 0) |
| $P_3$ | (2, 1, 1) | (2, 2, 2) | (0, 1, 1) |
| $P_4$ | (0, 0, 2) | (4, 3, 3) | (4, 3, 1) |
Safety Check Execution:
-
Can $P_0$ finish? Need (7, 4, 3) > Available (3, 3, 2). No.
-
Can $P_1$ finish? Need (1, 2, 2) $\leq$ Available (3, 3, 2). Yes!
-
Release: New Available = (3, 3, 2) + (2, 0, 0) = (5, 3, 2).
-
-
Can $P_2$ finish? Need (6, 0, 0) > (5, 3, 2). No.
-
Can $P_3$ finish? Need (0, 1, 1) $\leq$ (5, 3, 2). Yes!
-
Release: New Available = (5, 3, 2) + (2, 1, 1) = (7, 4, 3).
-
-
Can $P_4$ finish? Need (4, 3, 1) $\leq$ (7, 4, 3). Yes!
-
Release: New Available = (7, 4, 3) + (0, 0, 2) = (7, 4, 5).
-
-
Back to $P_0$: Need (7, 4, 3) $\leq$ (7, 4, 5). Yes!
-
Release: New Available = (7, 4, 5) + (0, 1, 0) = (7, 5, 5).
-
-
Back to $P_2$: Need (6, 0, 0) $\leq$ (7, 5, 5). Yes!
-
Release: Final Available = (10, 5, 7).
-
Safe Sequence Found: $<P_1, P_3, P_4, P_0, P_2>$. The system is safe!
6. Resource-Request Algorithm: Handling Real-Time Clicks
As a developer, this is the logic you trigger when a user clicks “Request” in your visualizer.
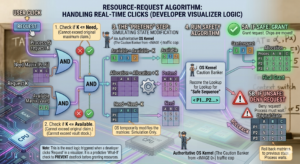
When $P_i$ requests $K$ resources:
-
Check if $K \leq Need_i$. (You can’t ask for more than you originally claimed).
-
Check if $K \leq Available$. (You can’t ask for more than the vault has).
-
The “Pretend” Step: The OS temporarily modifies the matrices:
-
Available = Available - K -
Allocation = Allocation + K -
Need = Need - K
-
-
Run the Safety Algorithm on this pretend state.
-
If Safe: Grant the request. The chips are moved.
-
If Unsafe: Deny the request. Roll back the matrices to their previous state. The process must wait.
-
7. The Visualizer’s Edge: UI/UX for Banker’s Algorithm
Building a visualizer for this is different from a simple Sorting or Pathfinding visualizer. You are dealing with matrices, not just arrays. Here is how to make it “Human-Friendly”:
-
Color-Coded Matrices: Use red for
Needthat is currently higher thanAvailable, and green forNeedthat can be satisfied. This helps the user see “potential” safe paths immediately. -
The Animation of Release: When a process finishes, show its
Allocationblocks physically flying back into theAvailablepool. This reinforces the concept that processes “return” resources. -
The “Unsafe” Warning: If a user makes a request that leads to an unsafe state, flash the screen orange (not red, because unsafe $\neq$ deadlock yet). Show the user that no matter how they try to order the remaining processes, someone will always be stuck.
8. Why Don’t We Use This in Windows or Linux?
You might wonder: “If this prevents deadlocks so perfectly, why does my laptop still freeze sometimes?”
The Banker’s Algorithm has significant real-world limitations:
-
Fixed Resources: It assumes the number of resources doesn’t change. In modern PCs, you can plug in a USB drive or RAM can be dynamically compressed.
-
Known Max Demand: Most applications (like Chrome or Photoshop) have no idea what their “Maximum RAM” will be. They just grab what they need until the system says “No.”
-
The “Wait” Problem: If the system is unsafe, a process might wait forever. In a user-facing OS, we prefer to let the process try, and if it deadlocks, we just “Kill” the process (Detection and Recovery).
However, in Real-Time Systems (like flight control software or medical equipment), where a deadlock could mean loss of life, the Banker’s Algorithm or similar avoidance strategies are absolutely essential.
9. Connecting to AI and Modern Architecture
For an AI student like you, Arsal, the Banker’s Algorithm is a gateway into Resource Constrained Reasoning.
In distributed AI training (like training a model across 8 GPUs), the orchestrator must decide how to allocate VRAM to different layers of the neural network. If it over-allocates to the early layers, the later layers might not have enough memory to compute the gradient—a deadlock in the training pipeline. The logic of “Safety Checks” and “Safe Sequences” is exactly how modern cluster orchestrators (like Kubernetes) keep your AI workloads running without crashing the hardware.
Conclusion
The Banker’s Algorithm is a masterpiece of logical caution. It teaches us that the best way to handle a crisis is to ensure the conditions for that crisis can never be met.
When you build your visualizer, remember that you aren’t just showing math; you’re showing the “Invisible Traffic Cop” of the computer world. By specifying every matrix update and every safety check in your UI, you’re giving your readers the ultimate cheat code to mastering one of the hardest topics in Operating Systems.
Now, it’s time to take this logic, open your IDE, and turn these matrices into an interactive experience that makes the “Banker” proud!